
 العربية
 English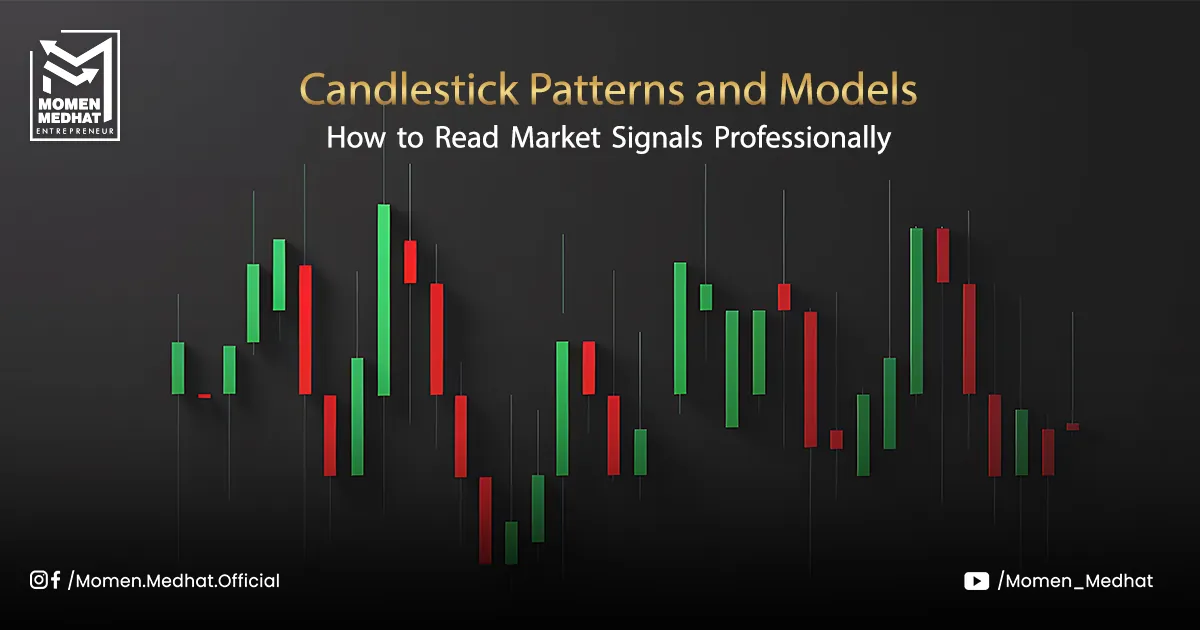
Japanese Candlestick Patterns: How to Read Market Signals Like a Pro
Welcome to a new article! Today, we’ll talk about one of the most important tools in technical analysis: Japanese Candlesticks. Whether you’re a beginner in trading or have some experience, Japanese candlesticks will be one of the most powerful tools to help you better understand the market. In this article, we’ll discuss Japanese candlestick patterns and how to use them smartly to make informed trading decisions.
What Are Japanese Candlesticks?
Japanese candlesticks are a way to represent price movements over a specific time period and are commonly used in technical analysis to understand trends and predict future market movements. The shape of a candlestick consists of several parts, including the body and the upper and lower wicks.
- Body: The filled part of the candlestick represents the distance between the opening and closing prices.
- Wick (or Shadow): The line that appears above or below the body shows the highest and lowest prices the market reached during the candlestick’s time period.
How to Read Japanese Candlesticks?
Each candlestick has a specific meaning, depending on its color and overall shape. If the candlestick is green or white, it means the market rose from the opening price to the closing price. If it’s red or black, it means the market fell.
Types of Japanese Candlestick Patterns
There are many Japanese candlestick patterns that help traders identify trends and market movements. Here are some basic patterns you might encounter:
- Engulfing Candlestick:
- Bullish Engulfing: When a green (or white) candlestick engulfs the previous red candlestick. This indicates a potential market uptrend.
- Bearish Engulfing: When a red candlestick engulfs the previous green candlestick. This signals a potential market downtrend.
- Hammer Candlestick:
This is a small-bodied candlestick with a long lower wick, indicating a potential market reversal, often signaling an upcoming uptrend. - Inverted Hammer:
Similar to the hammer, but the upper wick is longer than the lower one. It’s an indicator that the market is about to rise. - Morning Star and Evening Star:
- Morning Star: This pattern appears at the end of a downtrend and signals the start of an uptrend.
- Evening Star: This pattern appears at the end of an uptrend and signals the start of a downtrend.
- Big Bullish Candlestick:
When the candlestick’s body is very long, it indicates strong upward momentum.
How to Use Japanese Candlesticks in Trading?
The most important thing when using Japanese candlesticks is understanding timing and direction. When you spot a specific candlestick pattern in a particular area of the chart, you need to connect it with the overall market trend. Therefore, the stronger the support or resistance area where the candlestick appears, the stronger the signal.
Why Are Japanese Candlestick Patterns Important?
Japanese candlesticks not only give you an idea of the trend but also help you understand market sentiment. When you see a large candlestick in a specific direction, it could indicate that investors are confident in that direction. However, if the candlestick is small or has long shadows, it’s a sign of market indecision.
In Conclusion…
Japanese candlestick patterns are a powerful and essential tool in technical analysis. Understanding them will help you identify trends with greater accuracy. Over time, you’ll learn to recognize these patterns and use them effectively in your trading decisions.